The Power of Enriched Content: A Data-Driven Case Study on Increasing Blog Engagement
Content marketing is no longer just about writing compelling blog posts—it’s about creating a multi-layered experience for readers. From visuals to infographics, video, and audio, enriched content can make a measurable difference in engagement, retention, and even conversions.
Our recent analysis of multiple blogs across different industries reveals a compelling trend: some content pieces saw significant growth in traffic, while others declined. This case study dissects the results, focusing on what worked, why, and how businesses can optimize content to maximize impact.
Readers consume information differently. Some prefer in-depth articles, others prefer quick visuals, and many engage best with multimedia experiences. The best content strategies integrate various formats, ensuring broader appeal and stronger retention.
Integrating these formats ensures that content resonates with different audience preferences and enhances user experience.
Infographics are among the most effective tools for engagement. They serve two key purposes:
In today’s fast-paced digital world, where attention spans are shorter than ever, infographics serve as a balance between depth and accessibility.
In 2024, we added infographics to 17 struggling or stagnant blog posts across various industries for different clients. These posts were previously underperforming in terms of traffic and engagement, despite being well-written and optimized using keyword research.
Now that over six months have passed since the infographics were integrated, we’ve analyzed the impact. The results examine the correlation between visual content enhancement and improved user engagement metrics.
Our analysis of multiple blog posts revealed several content pieces experienced a notable increase in traffic, while others declined or remained static. To maintain confidentiality, exact figures are omitted, but percentage increases highlight the impact of well-optimized content:
Interestingly, the pieces that saw the greatest growth were not necessarily the longest or most keyword-heavy but rather the most engaging and well-structured.
Infographics are a powerful way to convey complex information visually, but they shouldn’t exist in isolation. For maximum SEO impact, they need to be integrated with well-structured text that provides substantial explanations. Google primarily reads and ranks the accompanying text, not the image itself, so pairing infographics with high-quality, keyword-rich content enhances both user experience and search visibility.
A strong infographic distills and condenses the most useful information into an easily digestible format while reinforcing the key takeaways from the article. It should act as a quick reference tool for readers, helping them grasp essential concepts without replacing the depth of written content.
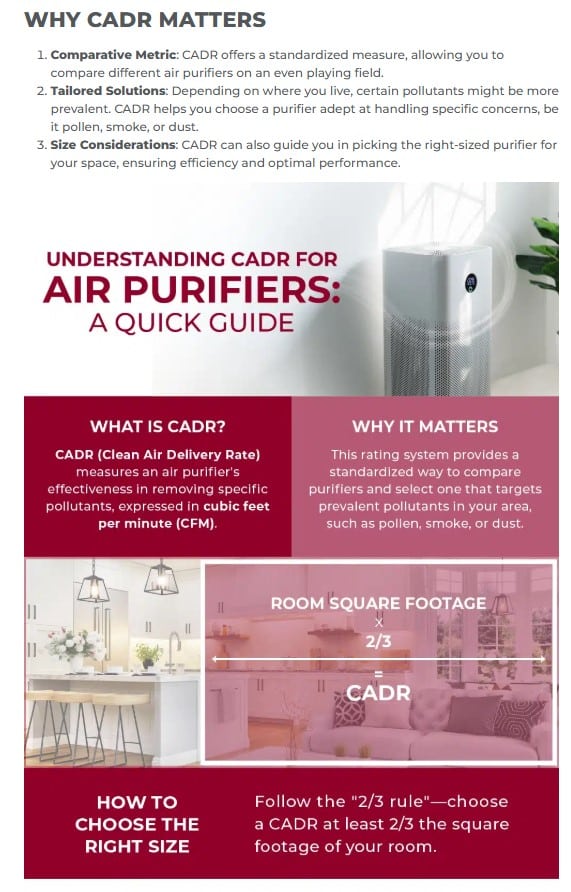
In a screenshot of one of our infographics below, the article explains CADR (Clean Air Delivery Rate)—a metric that measures the efficiency of an air purifier—while the infographic visually represents what users will want to know quickly, such as:

The article continues beyond this infographic by providing more context as well as a CTA funnel for the client.
By structuring the content this way, the infographic provides immediate value by answering the most pressing question searchers likely have (how to calculate CADR for their needs), while the supporting text ensures a thorough understanding that benefits SEO.
Not all content pieces performed equally. Some blog posts experienced traffic declines, and potential reasons include:
While declines are not ideal, they provide critical insights into content optimization strategies moving forward. We do want to stress, however, that adding useful images and infographics are not likely to ever directly cause a decline in traffic (unless they are slowing down the post).
With over half of the blog posts showing measurable improvement, the data reinforces that ongoing content improvements deliver real results. Even if only a quarter of our sample saw significant gains, the return on investment is clear—any measurable improvement validates the effort. In content marketing, progress isn’t always about perfection but about continuous refinement with growth in mind.
Search engine optimization is critical, but content must go beyond rankings. The real goal is delivering value in a way that captures attention, holds interest, and prompts action.
When content is enriched with multimedia elements, strategic formatting, and visual aids, it becomes:
A focus on quality engagement over keyword stuffing is what ultimately drives long-term content success.
A content marketing strategy should never be “set it and forget it”. It’s a dynamic process that requires regular evaluation and refinement. Even well-performing blog posts can lose traction over time due to shifting search trends, evolving user behaviour, and algorithm updates. This is why routine blog audits are essential.
That said, when revisiting older content, improvements shouldn’t just mean adding an infographic. Each post usually needs a personalized “treatment plan” based on what’s lacking and what users searching for that content might benefit most from.
Other high-impact adjustments include:
A data-driven approach to content updates ensures that blog posts remain valuable, discoverable, and relevant. Regular optimization keeps content working for your business rather than fading into obscurity.
Numbers aside, the findings are clear: well-structured, engaging, and enriched content outperforms plain or thin content. The right mix of written depth, visual clarity, and interactive elements can transform blog performance.
Want to take your content to the next level? Our team specializes in creating high-impact content strategies that blend SEO expertise with compelling storytelling. Contact us today to see how we can help you maximize engagement and conversions.